For two decades now, lead has been very strongly suspected of causing crime.
Does it hold up?
- Overview
- More Recent Studies
- No Safe Level Of Lead
- Bit Of A Stretch?
- Too Parallel To Be True?
- Biased Data
- Hopelessly Confounded
- Publication Bias Strikes Again
- Biodeterminism
- Endnotes
Overview
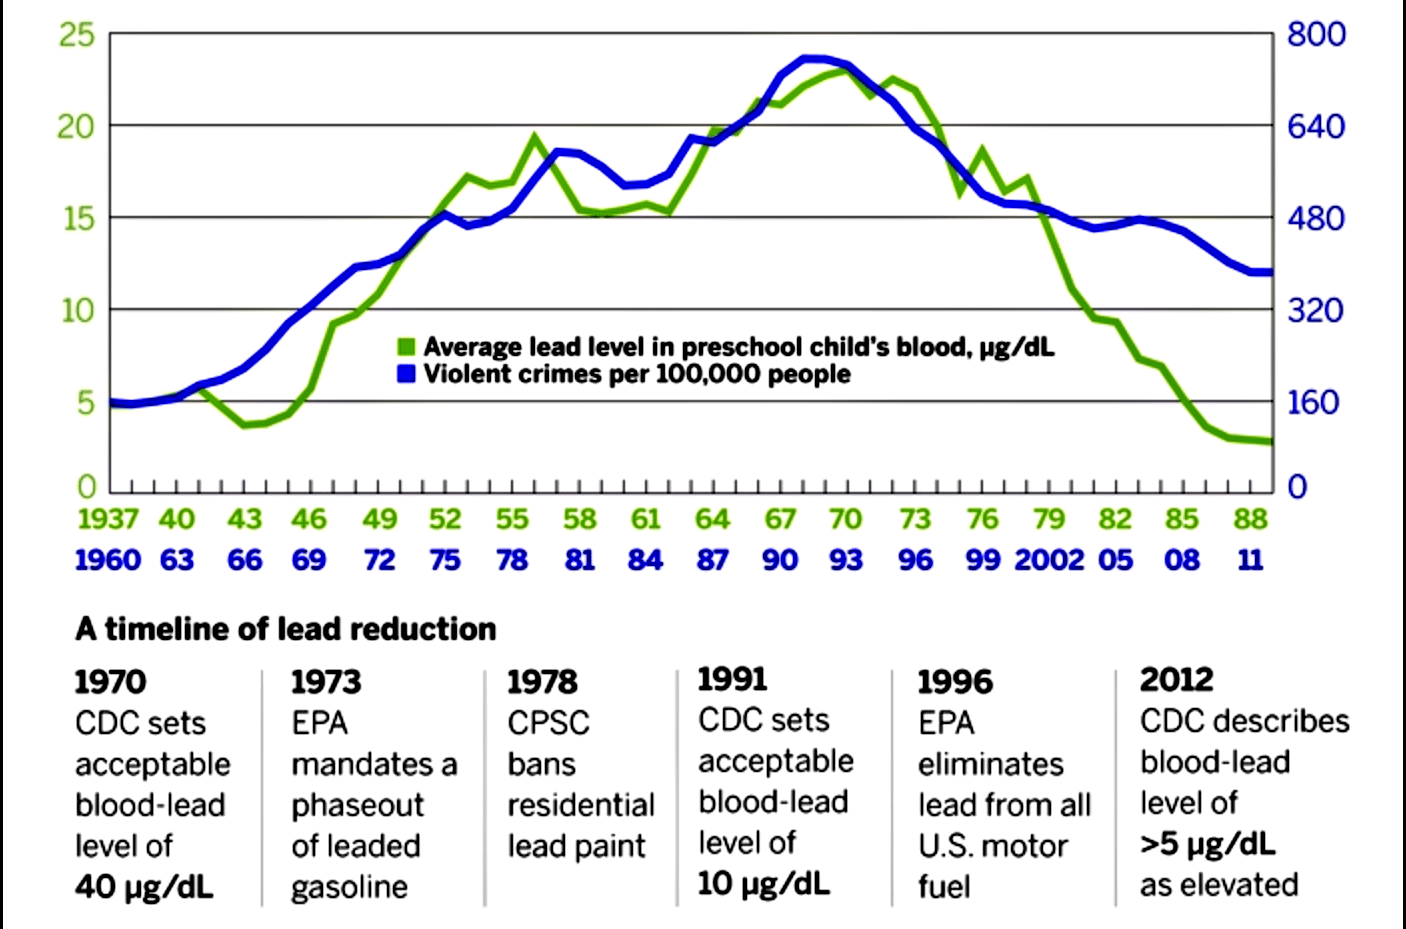
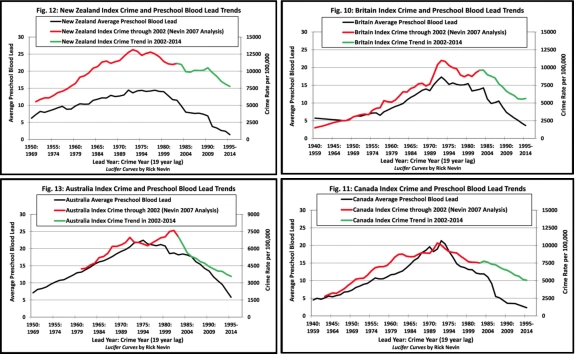
A 2000 paper found that if you add a lag time of 23 years, lead emissions from automobiles explained 90% of the variation in violent crime in the US. A 2007 paper found more or less the same effect in Great Britain, Australia, New Zealand, Finland, France, Italy, and West Germany:
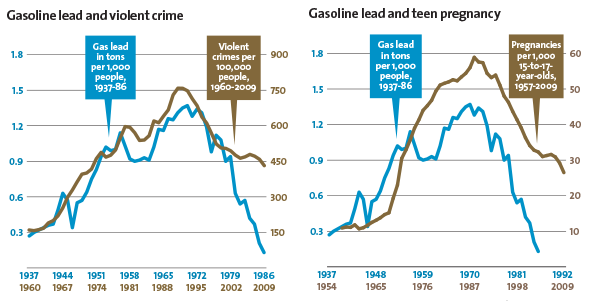
Another 2007 paper found that the phase-out of lead from gasoline in the US was responsible for a 56% decline in violent crime between 1992 and 2002. A 2011 paper found that the UN-led global effort in de-leading resulted in 58 million fewer crimes. A 2012 paper found that variation in air Pb emissions explained 90% of variation in aggravated assault in six US cities that had good crime and lead data going back to the ’50s.
More Recent Studies
I have to say I was quite convinced when I first read about it. Kevin Drum popularised it in 2013, and (up to 2018) has covered it extensively in two dozen other articles, and highlighted a dozen more papers since 2012 that support the lead-crime hypothesis.
In Charlotte, North Carolina, kids who received intervention reducing blood levels from 15 µg/dl to about 5 µg/dl grow up to commit fewer violent crimes. In the US, cities with lead pipes had homicide rates 24% higher than cities with iron pipes. In Australia, the variance in air lead explained 30% of the variance in assault rates with a 21-years time lag at the suburb-level, consistent with the state, and national level. In St. Louis, Missouri, elevated blood lead levels (n=59,645) strongly correlate with crime occurrence (n=90,433) across census tracts.
The statistics have Andrew Gelman’s approval; the correlation seems real – not just an artifact of a particular regression specification. Though note that they’re all observational so we shouldn’t overinterpret it.
No Safe Level Of Lead
Lead is a neurotoxin (among other things) that crosses the immature blood-brain barrier to impair fronto-executive functions in children even at low levels, and children absorb more lead per unit body weight than adults (50% vs 10% of a glass of leaded water).
Blood lead levels (BLL) are measured in micrograms per deciliter (µg/dL), and in the 60s, it wasn’t considered elevated unless they exceeded 60 µg/dL. It’s not until 1991 when the CDC changed the cutoff to 10 µg/dL and in 2012, changed it again to 5 µg/dL based on the 97.5th percentile of the BLL distribution among children aged 1-5. In the US, 550,000 children have BPb levels at or above 5 mg/dL, 150,000 of whom have levels of at least 10 mg/dL. Globally, UNICEF estimates that more than 40% of children have BPb levels above 5 mg/dL.
This 2020 paper found that a 10% reduction in local moss lead levels corresponds to a 4.7% decrease in blood lead levels in Swedish primary school children (n=800,000 with 30-year followup), and the drop in local air lead levels between 1982 and 1994 can account for as much as 50% of the change in children’s BPb levels. The key thresholds are 5 µg/dL for high school completion and noncognitive skills, and 7 µg/dL for crime. Surprisingly, there wasn’t a clear threshold for high school GPA, and the authors failed to find a significant effect for cognitive skills at age 18 even at higher thresholds.
Perhaps it would be more surprising that extensive lead poisoning doesn’t have any effect on kids. It certainly makes for a compelling story, but the jump from the neurotoxic effects of lead to crime is complicated by a myriad of factors, so my priors were relatively low coming in.
Bit Of A Stretch?
Any claim based on correlations between such widely separate variables as lead exposure (the cause) and crime (the effect) are immediately suspect. The causal chain from vitamin C intake to scurvy cure, for example, is just one step. In the lead-crime hypothesis, the causal chain is something like 1) kids were exposed extensively to tetraethyl lead gasoline additive since the 1920s, 2) the neurotoxicity of lead causes kids to be more aggressive and dumber, 3) impaired decision-making and impulse control causes kids to do worse in school, 4) lower education outcomes lowers opportunity cost to commit crime, plus increased impulsivity, causes the now-young-adults to commit more property and violent crimes.
The lead-crime hypothesis only correlates the first and last link in the chain, but it would be more convincing if there were evidence about the intervening links. For instance, presumably most kids exposed to lead were more impulsive while only a minority of the impulsive young adults commit crimes, as the latter effect is time-lagged and necessarily diluted by other factors like policing and incarceration. If that’s true, we should expect to see very strong changes in IQ, school achievement, impulsiveness, aggressiveness, and lack of conscientiousness, all with less time lag.
As Stephen Pinker noted, it’s the same flaw that torpaedoed Freakonomic’s abortion-crime hypothesis: supposedly legalised abortion led to fewer unwanted babies, which led to fewer maladjusted and violent young men two decades later. Turns out the assumption that states which completely legalised abortion had higher abortion rates than states where abortion was only legal under certain conditions before Roe v. Wade, was simply untrue. When you zoomed into the causal chain, it fell apart.
So do we see the shorter-term effects of lead?1 In the US, blood lead levels in children aged 1-5 did decrease 84% from 1988–1991 to 1999–2004. In Rhode Island, childhood blood lead levels and distance from major roadways predicted school suspensions and juvenile detentions. A 2019 paper following up 579 New Zealand children after 30 years found that each 5-μg/dL increase in childhood blood lead level was associated with a 1.34-point (standardised mean of 100) increase in general psychopathology, a 0.10-SD increase in neuroticism, a 0.09-SD decrease in agreeableness, and a 0.14-SD decrease in conscientiousness.
So far the lead-crime hypothesis is holding up pretty well.
Too Parallel To Be True?
The lead-crime hypothesis assumes the effects of lead exposure are the greatest in childhood, but not every crime-prone, lead-laden young adult starts rummaging and pillaging the moment they hit age 23 – the effects of age on crime is a very gentle bulge spread over the 15-30 age range, not a sharp fall-off. As Stephen Pinker noted, the time-lagged curve for crime should be an attenuated, smeared version of the curve for lead, not a perfect copy of it. I couldn’t find any paper addressing this issue.
Another angle is that around 5% of the population are responsible for 50% of crime, so the Great American Crime Decline is likely due to falls in this high-crime population, rather than less crimes per individual in that population.
Biased Data
Researchers can basically pick between National Crime Victimization Survey (NCVS) and the Uniform Crime Reports (UCR) to look at US crime trends. This 2015 paper found NCVS trends in serious violence to be more highly correlated with homicide data than UCR trends, which suggests that the NCVS is a more valid indicator of long-term trends in violence for crimes other than robbery.
Problem is that most of the studies looking at the lead-crime hypothesis rely on only one data source, and most often that is the UCR. Data from UCR suggest that serious violence was lower in the mid-70s than it was after the crime decline of the 90s, while the NCVS data suggest that serious nonfatal violence was a lot higher throughout the 70s and 80s than it was after the 90s crime decline.
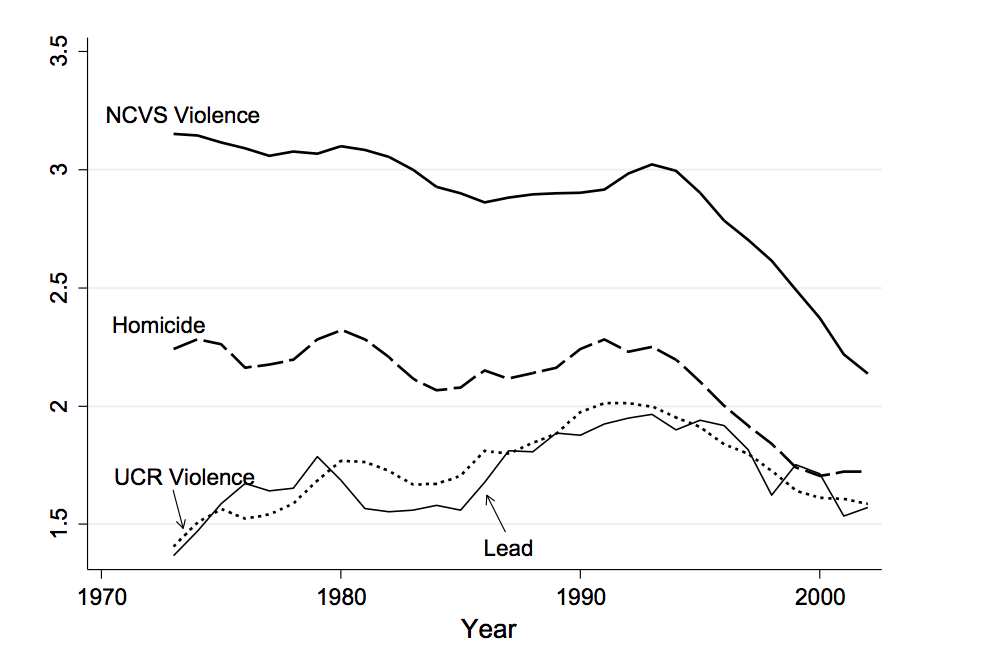
This meant that trends in lead exposure were associated only with UCR nonlethal violence rates, and not with NCVS violence rates or homicide rates.
More generally, no agency tracks crimes by the age of the perpetrator – the data just doesn’t exist. Cohort analysis based on murder rates in the 80s is unlikely to have the statistical power to tell us much, and since age data for other crimes and other eras doesn’t exist, we’ll never get anything better.
Hopelessly Confounded
Is it even possible to have a smoking gun? Causal hypotheses based on epidemiological correlations between widely separated causes and effects have endless confounders – neighborhoods next to smoggy freeways also tend to be poorer, more poorly policed, more poorly schooled, less stable, more dependent on contraband economies, and so on. It’s all too easy to find spurious correlations in this tangle, which is why so many epidemiological studies of the cause and prevention of disease fail to replicate.
More generally, my confidence in the findings from social sciences have tanked pretty hard by the Replication Crisis (which I will cover in future posts) – a large fraction, if not most, of social science and other fields is simply random noise that cannot be replicated, due to p-hacking, low statistical power, publication bias, and other sources of systematic error.
Causal graphs are also probably denser than you think – the number of indirect connections grows exponentially faster than the number of direct connections, so any given indirect connection is vastly unlikely to be a direct connection, and thus manipulating one variable will not affect the other. Our intuition formed in simple domains designed to have sparse causal networks just sucks in predicting things as complex as crime.
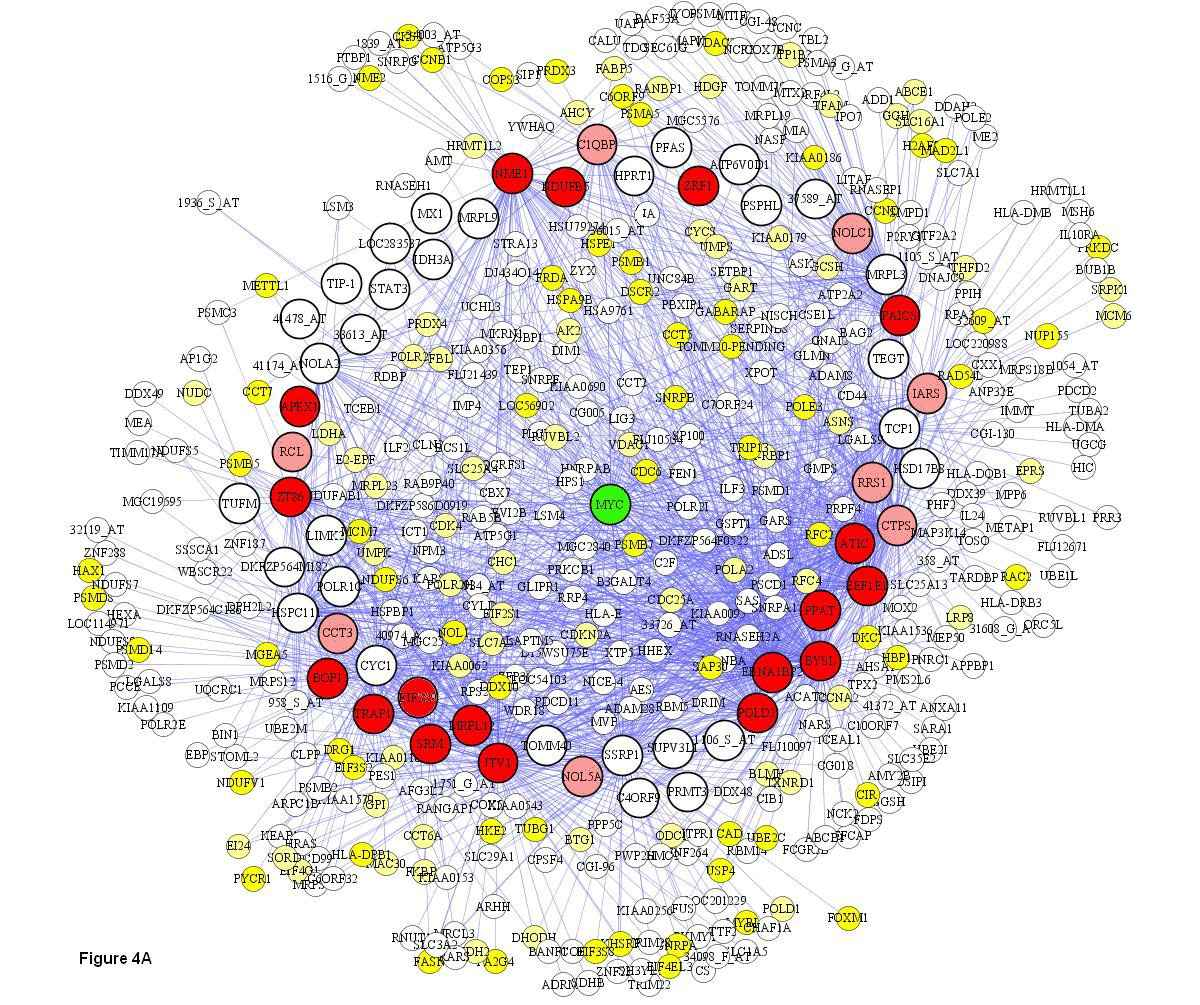
I can’t even cram half of the nodes of this metabolic network into my head.
My priors were pretty low, safe to say. There doesn’t seem to be much I can do besides repeating ‘correlation ≠ causation’ ad nauseam.
Publication Bias Strikes Again
Enter the one and only meta-analysis. Higney et al. looked at the effects of lead on crime from 24 studies.
In a funnel plot, if there is no publication bias, high-precision studies are plotted near the average, low-precision ones are spread evenly on both sides of the average. Below is the plot for the 24 studies; the clearly missing studies on the left (negative) side indicate possible publication bias:
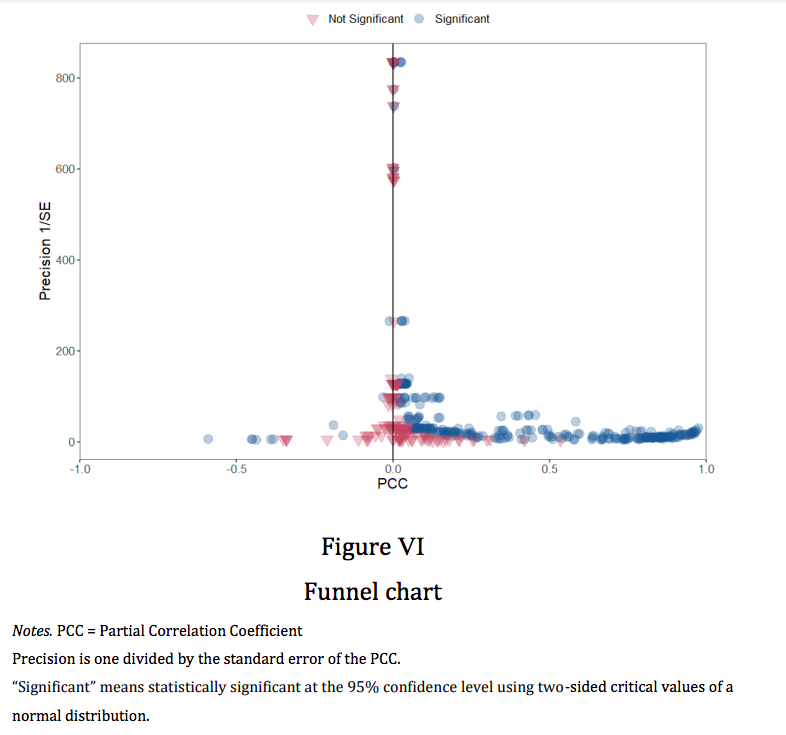
Negative and significant estimates are 200 times less likely to be published than positive, significant ones.
In a forest plot, the vertical line means no effect. For each study, the further to the right the black square, the bigger the effect size (in this case partial correlation coefficient, or PCC); the wider the horizontal line/whiskers, the larger the confidence interval (the more unreliable); the greater the weight/size of the black square, the greater the power (e.g. due to greater sample size and smaller confidence interval) i.e. the weight they have in the meta-analysis. The 24 studies:
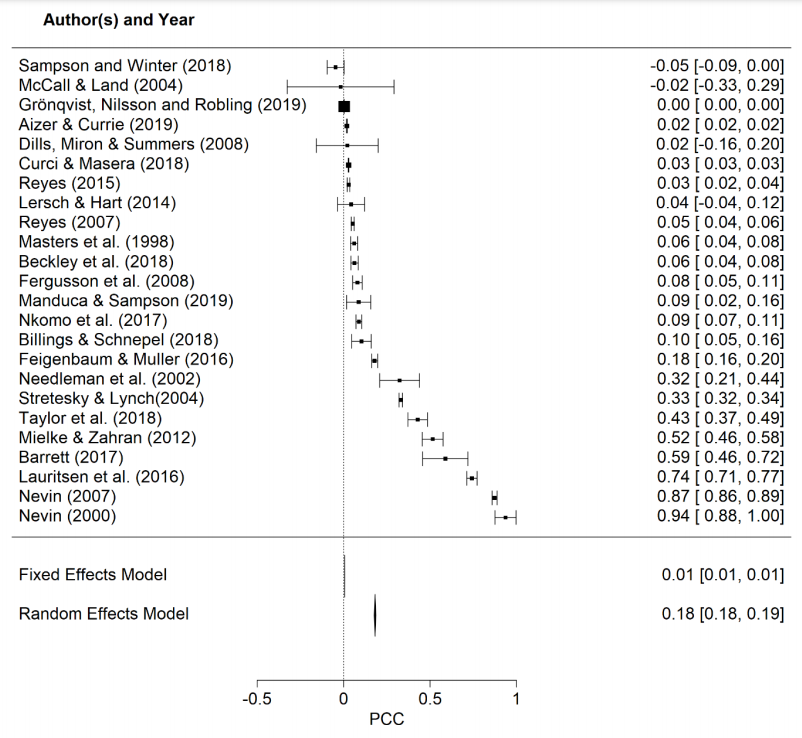
So the median PCC evaluated at the sample averages for the full sample is 0.11, a small effect size, which is nonetheless over ten times larger than the high-quality sample. Back-of-envelope calculations converting PPC into elasticities gave a range of 0.22-0.02 for the full sample and 0.03-0.00 for the high-quality, addressing endogeneity sample. This suggests the fall in blood lead levels may have led to a fall in homicide in the US of between 3-36% with the full sample elasticity, and between 0-5% for the addressing endogeneity sample elasticity.
Biodeterminism
Overall, the results suggest that the fall in lead levels cannot explain most of the fall in crime observed in many western countries; the upper end of the range of elasticities would imply the lower lead pollution today saves around 6,000 lives a year in the US, while the lower would mean lead has no effect and we must look to other causes entirely.
Like omega-6 fatty acids.
With the advent of industrial food processing, soybean oil, corn oil, cottonseed oil and other industrial creations have replaced milk and meat fat in our diet, while total fat consumption has remained relatively constant. The result is that we’re eating a lot more polyunsaturated fat than we were just 30 years ago, most of it linoleic acid (omega-6).
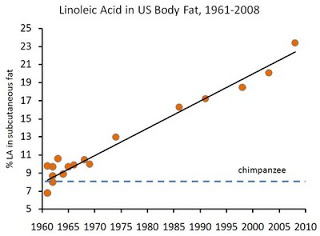
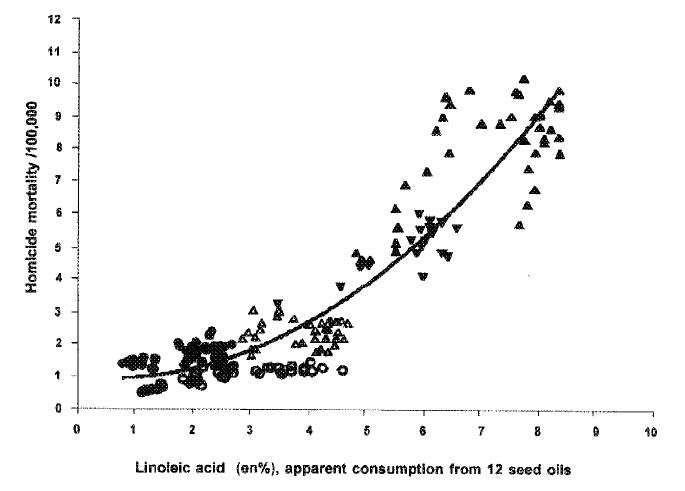
Now take this 2004 paper that looked at 12 major seed oils in the food supply for the years 1961 to 2000 in Argentina, Australia, Canada, the United Kingdom, and the United States, and boy does it correlate with homicide rates. Stephan Guyenet doesn’t think we can draw any solid conclusions from this, but it is worth noting that epidemiological associations don’t get much better.
Corn oil may taste so bad it inspires you to violence, but its insidiousness goes beyond the flavor.
Or this 2001 paper that found a linear correlation between the increase in omega-6 fatty acids consumption from seed oils in 38 countries since the 1960s, and the rise in murder rates over the same period.
Or this famous 2002 double-blinded placebo-controlled, randomised trial of dietary supplements including fish oil vs placebo to 231 prisoners found a 26.3% drop in prison violence (p = .03) using intention to treat and 35% (p = .001) using completers. A 2010 replication study on 221 Dutch prisoners found almost exactly the same results. A 2000 paper of 468 children aged 6-12 found an even more drastic 47% decrease in antisocial behavior.
No really, everything is correlated. When we systematically measure many variables at a large enough scale, even things which seem to have no causal relationship show real correlation with high confidence. If you fail to reject the null hypothesis with p < 0.05, you simply haven’t collected enough data yet.
You can manufacture arbitrarily many spurious results by data mining, and sometimes you find that fish oil makes men kill fewer people. A Comprehensive review of the literature on the effects of omega-3 fatty acids on mental health basically dismisses everything done thus far as insufficient to draw meaningful conclusions. Maybe omega-6 studies hold up better but I’m not keeping my hopes up that they’ll replicate in the year of our lord 2021.
Like Scott Alexander, I am biased towards biodeterminism – I suspect most social influences matter less than anyone thinks and most biological influences matter more than anyone thinks. So the lead-crime hypothesis sounded pretty appealing to me, and so does the omega-6 story, even if it smells fishy.
All in all I’m glad economists were able to find a cause for crime despite the inability of lead levels to explain most of the variation. Empirically, most efforts to change human behavior in sociology, economics, education fail in RCTs and the mean effect size in meta-analyses typically approaches zero, per the Metallic Laws. So Clair Cameron Patterson is (still) an unsung hero for his seminal anti-lead campaign, which could accidentally be one of the most effective War-on-Crime policies in history.
Endnotes
-
We know that the Flynn effect is real – IQ has been rising 2-3 points per decade since the invention of the IQ test. Curiously, I have never seen lead exposure being mentioned as one of the environmental factors, perhaps because the secular rise in IQ is near-constant beginning in the 1940s, which doesn’t track lead exposure even with a time lag. ↩